A Bearish Engulfing Candlestick Pattern indicates a potential reversal from an uptrend to a downtrend. It consists of a small bullish candle followed by a larger bearish candle.
The Bearish Engulfing Pattern is a crucial tool for traders. It signals a potential shift in market sentiment from bullish to bearish. This pattern forms when a small green candle is fully engulfed by a larger red candle, suggesting sellers have taken control.
Traders often use this pattern to identify selling opportunities or to exit long positions. Recognizing this pattern can help in making informed trading decisions. It is most effective when confirmed with other technical indicators or patterns. Understanding and identifying this pattern can enhance your trading strategy.

Credit: www.dailyfx.com
Introduction To Bearish Engulfing
The Bearish Engulfing Candlestick Pattern is crucial for traders. It signals a potential price reversal. Understanding this pattern helps traders make informed decisions.
Definition
A Bearish Engulfing pattern consists of two candlesticks. The first is a small green (bullish) candle. The second is a larger red (bearish) candle. The red candle completely engulfs the green candle. This pattern indicates strong selling pressure.
Importance In Trading
The Bearish Engulfing pattern is important for several reasons:
- Reversal Signal: It often signals a reversal of an uptrend.
- Market Sentiment: It shows a shift from buyers to sellers.
- Entry Point: Traders use it to decide entry points for short positions.
- Risk Management: Helps in setting stop-loss levels.
Recognizing this pattern can improve trading strategies. It enables traders to anticipate market movements.
| Feature | Description |
|---|---|
| First Candle | Small green (bullish) candle |
| Second Candle | Large red (bearish) candle |
| Pattern Indication | Potential price reversal |
Understanding the Bearish Engulfing pattern is essential. It helps traders spot potential trend reversals.
Anatomy Of Bearish Engulfing
The Bearish Engulfing Candlestick Pattern is a key signal in trading. It indicates a potential reversal in an uptrend. Understanding its structure and characteristics is essential for traders.
Candlestick Structure
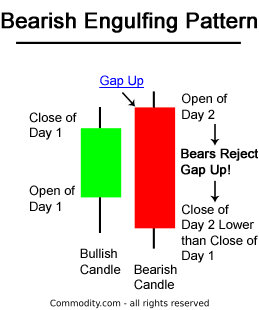
The Bearish Engulfing pattern consists of two candlesticks. The first is a small green (bullish) candle. The second is a large red (bearish) candle. The body of the red candle completely engulfs the body of the green candle. This pattern suggests strong selling pressure.
Key Characteristics
- The first candle is small and bullish.
- The second candle is large and bearish.
- The second candle’s body engulfs the first candle’s body.
- Occurs at the end of an uptrend.
- Indicates a potential market reversal.
| Characteristic | Description |
|---|---|
| First Candle | Small and bullish |
| Second Candle | Large and bearish |
| Engulfing | Red candle engulfs green candle |
| Trend | Occurs at end of uptrend |
| Signal | Potential reversal |
Formation Process
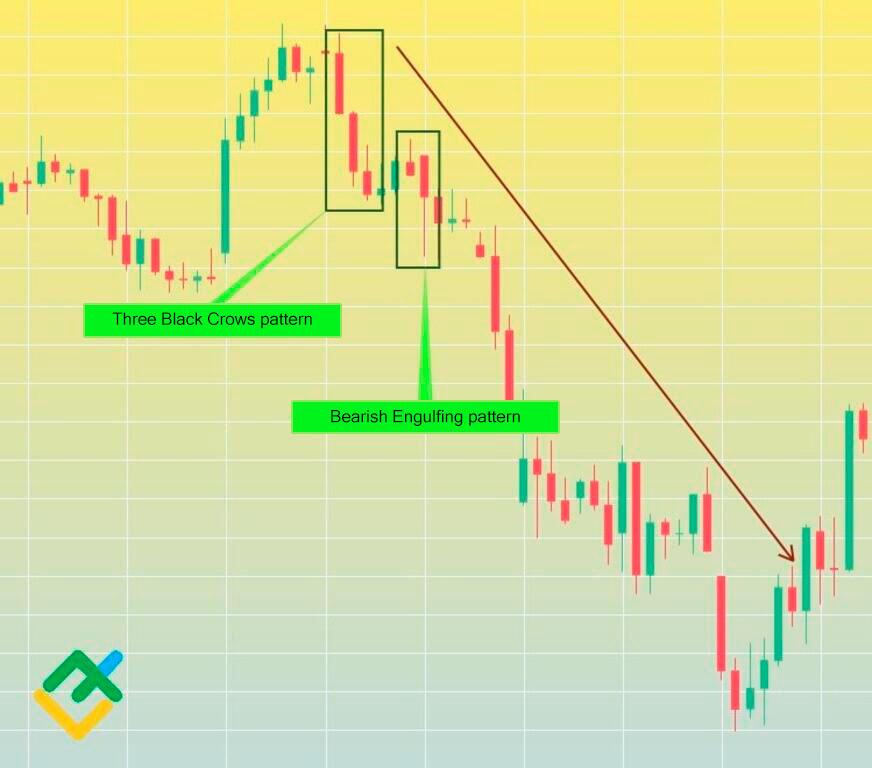
The Formation Process of the Bearish Engulfing Candlestick Pattern is crucial for traders. Understanding this process helps in making informed decisions. This pattern signals a potential reversal in the market. Let’s delve into the specifics of its formation.
Market Conditions
The Bearish Engulfing Candlestick Pattern appears in an uptrend. Traders should look for a bullish market trend. This pattern indicates a shift from bullish to bearish sentiment. It often warns of a potential price decline.
Steps To Formation
- The market is in an uptrend.
- A small bullish candlestick forms. This candle has a small body and short shadows.
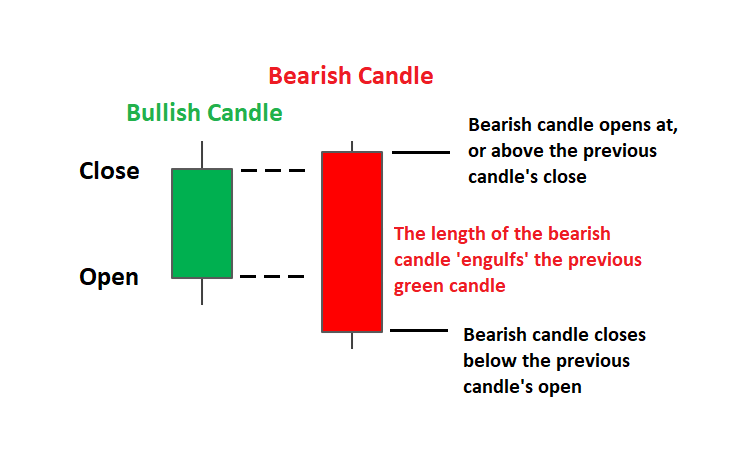
- On the next day, a larger bearish candlestick appears. This candle completely engulfs the previous day’s body.
- The opening price of the bearish candle is higher than the previous close.
- The closing price of the bearish candle is lower than the previous open.
| Step | Description |
|---|---|
| 1 | Market in an uptrend |
| 2 | Small bullish candlestick forms |
| 3 | Larger bearish candlestick appears |
| 4 | Bearish candle opens higher than previous close |
| 5 | Bearish candle closes lower than previous open |
Each step in the formation process is vital. The pattern must meet these criteria to be valid. Traders often use this pattern to predict a market reversal.

Credit: www.litefinance.org
Significance In Technical Analysis
The Bearish Engulfing Candlestick Pattern holds great significance in technical analysis. It helps traders identify potential trend reversals. This pattern can signal market sentiment changes, offering valuable insights into future price movements.
Trend Reversal Indicator
The Bearish Engulfing Pattern often appears at the end of an uptrend. It suggests a possible shift to a downtrend. This pattern consists of two candles. The first candle is bullish, followed by a larger bearish candle. The second candle completely engulfs the first one, indicating strong selling pressure. This can be a powerful trend reversal signal.
| First Candle | Second Candle |
|---|---|
| Bullish | Bearish |
| Smaller | Larger |
Market Sentiment
The Bearish Engulfing Pattern reveals significant market sentiment. It indicates that sellers have taken control. Traders often view this as a sign of weakening bullish momentum. The larger bearish candle shows increased selling pressure. This shift in sentiment can lead traders to anticipate further declines. Recognizing this pattern helps traders make informed decisions.
- Identifies trend reversals
- Shows market sentiment changes
- Helps anticipate future price movements
Understanding the Bearish Engulfing Pattern is crucial for successful trading. It provides valuable insights into the market. This pattern helps traders predict potential downtrends.
Identifying Bearish Engulfing
A Bearish Engulfing Candlestick Pattern is a key indicator in technical analysis. Traders use it to identify potential reversals in the market. This pattern signals a shift from bullish to bearish sentiment. Recognizing this pattern can help traders make informed decisions.
Visual Cues
Visual cues are essential for identifying the Bearish Engulfing Candlestick Pattern. This pattern consists of two candlesticks:
- The first candle is bullish, closing higher than its open.
- The second candle is bearish, completely engulfing the first candle’s body.
The second candle’s body should be larger than the first. It should cover both the open and close of the previous candle. This visual signal indicates strong selling pressure.
Confirmation Signals
Confirmation signals help verify the Bearish Engulfing Pattern. These signals increase the reliability of the pattern. Look for the following:
- Volume Increase: Higher volume during the bearish candle strengthens the signal.
- Support Levels: Breaking key support levels confirms the bearish trend.
- RSI Indicator: An overbought condition on the RSI can add validity.
These confirmation signals can enhance your trading strategy. They help ensure the Bearish Engulfing Pattern is valid.

Credit: www.dailyfx.com
Trading Strategies
Understanding the Bearish Engulfing Candlestick Pattern can help traders. It signals potential reversals in the market. Implementing effective trading strategies is crucial. This section will guide you through entry and exit points and risk management.
Entry And Exit Points
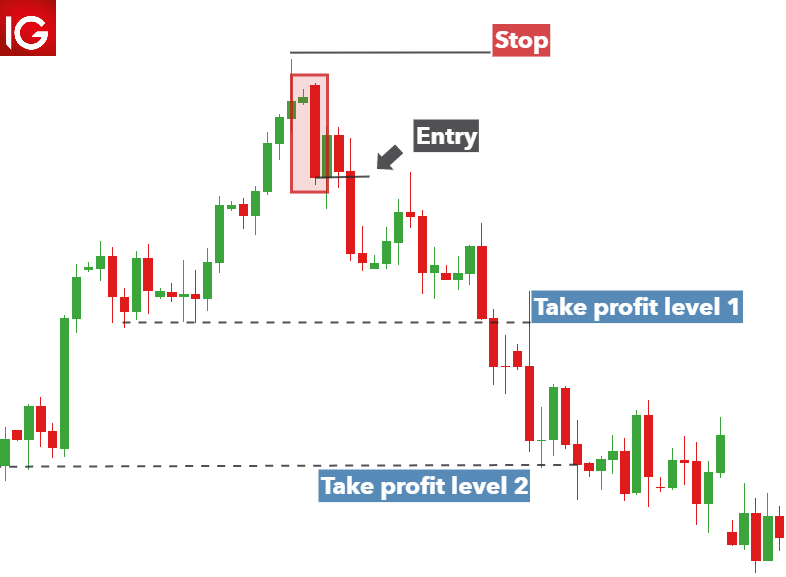
Identifying the right entry point is essential. Look for a large bearish candle. It should engulf the previous bullish candle. This pattern indicates a potential market downturn.
For an entry point:
- Wait for the bearish candle to complete.
- Confirm the pattern with volume indicators.
- Enter the trade at the opening of the next candle.
Exiting a trade is equally important. Set a target price based on previous support levels. Consider using trailing stops to lock in profits.
For an exit point:
- Set a stop-loss above the high of the engulfing candle.
- Use trailing stops to secure profits.
- Monitor market conditions regularly.
Risk Management
Effective risk management is crucial for trading success. Always use stop-loss orders to limit potential losses. Determine your risk tolerance before entering a trade. This helps in making informed decisions.
Key risk management strategies include:
- Setting a stop-loss at a safe distance.
- Using proper position sizing.
- Regularly reviewing your trades.
Keeping emotions in check is vital. Stick to your trading plan. Avoid making impulsive decisions. Managing risk effectively ensures long-term profitability.
Common Mistakes
Understanding the Bearish Engulfing Candlestick Pattern is crucial for traders. However, even experienced traders can make mistakes. Knowing these mistakes can help you trade smarter.
False Signals
One of the most common mistakes is falling for false signals. Not all patterns indicate a true reversal. Sometimes, the market can give misleading cues.
- Ignore smaller time frames
- Avoid trading in low volume markets
- Confirm with other indicators
Always verify the signal with additional analysis. Relying solely on the Bearish Engulfing pattern can be risky.
Overtrading
Another frequent mistake is overtrading. Traders often get excited and make too many trades. Overtrading can drain your capital and lead to losses.
- Set a trading limit
- Stick to your strategy
- Review your trades regularly
Overtrading often leads to emotional decisions. Stick to a disciplined approach for better results.
Real-world Examples
Understanding the Bearish Engulfing Candlestick Pattern is crucial for traders. To grasp its significance, examining real-world examples is essential. This section highlights historical and recent examples. These examples showcase how this pattern impacts market trends.
Historical Cases
Historically, the Bearish Engulfing Candlestick Pattern has signaled major market shifts. Let’s explore some notable instances:
| Year | Stock/Index | Outcome |
|---|---|---|
| 2008 | Dow Jones Industrial Average | Signaled the start of a major downturn |
| 2000 | Nasdaq Composite | Preceded the dot-com bubble burst |
Recent Market Examples
Recent markets have also shown the power of the Bearish Engulfing Candlestick Pattern. Here are some recent cases:
- 2021: Tesla stock formed a bearish engulfing pattern. This preceded a short-term decline.
- 2022: Bitcoin experienced a bearish engulfing pattern. This led to a significant price drop.
These examples demonstrate the pattern’s effectiveness in predicting market trends.
Advanced Tips
Understanding the Bearish Engulfing Candlestick Pattern is crucial for traders. Advanced tips can help you improve your trading strategy. Let’s dive into some advanced tips to enhance your trading skills.
Combining With Other Indicators
Combining the Bearish Engulfing Candlestick Pattern with other indicators increases accuracy. Use Moving Averages to confirm the trend direction. If the candlestick forms below the moving average, it signals a stronger downtrend.
You can also use the Relative Strength Index (RSI). When RSI is above 70, it indicates overbought conditions. A Bearish Engulfing Pattern here suggests a potential reversal.
Another useful tool is the MACD. Look for bearish crossovers to strengthen your analysis. Combining these indicators provides a comprehensive market view.
Adapting To Market Conditions
Adapting to market conditions ensures better trading decisions. In a volatile market, the Bearish Engulfing Candlestick Pattern may appear frequently. Use higher timeframes to filter out false signals.
In a trending market, the pattern can signal trend reversals. Confirm the pattern with volume indicators. Higher volume during the pattern formation indicates strong selling pressure.
Adjust your strategy based on the market phase. In a consolidation phase, this pattern may signal a breakout. In a trending phase, it may signal a pullback or reversal.
Frequently Asked Questions
What Does A Bearish Engulfing Candlestick Indicate?
A bearish engulfing candlestick indicates a potential reversal from an uptrend to a downtrend. It shows strong seller dominance.
What Happens After A Bearish Engulfing Candle?
A bearish engulfing candle often signals a potential trend reversal. Traders may expect a downward price movement. It’s crucial to confirm with additional indicators.
How Accurate Is A Bearish Engulfing Candle?
A bearish engulfing candle is often accurate in predicting price reversals. It signals potential downward trends. Traders consider it reliable, but it’s not foolproof. Always use additional indicators for confirmation.
What Is The Difference Between Bullish And Bearish Engulfing?
A bullish engulfing pattern indicates a potential upward trend, while a bearish engulfing pattern suggests a possible downward trend.
Conclusion
Understanding the Bearish Engulfing Candlestick Pattern is crucial for traders. It signals potential market reversals. Recognizing this pattern can help make informed decisions. Always combine it with other indicators for better accuracy. Stay updated, practice regularly, and sharpen your trading strategies for success.
Happy trading!
